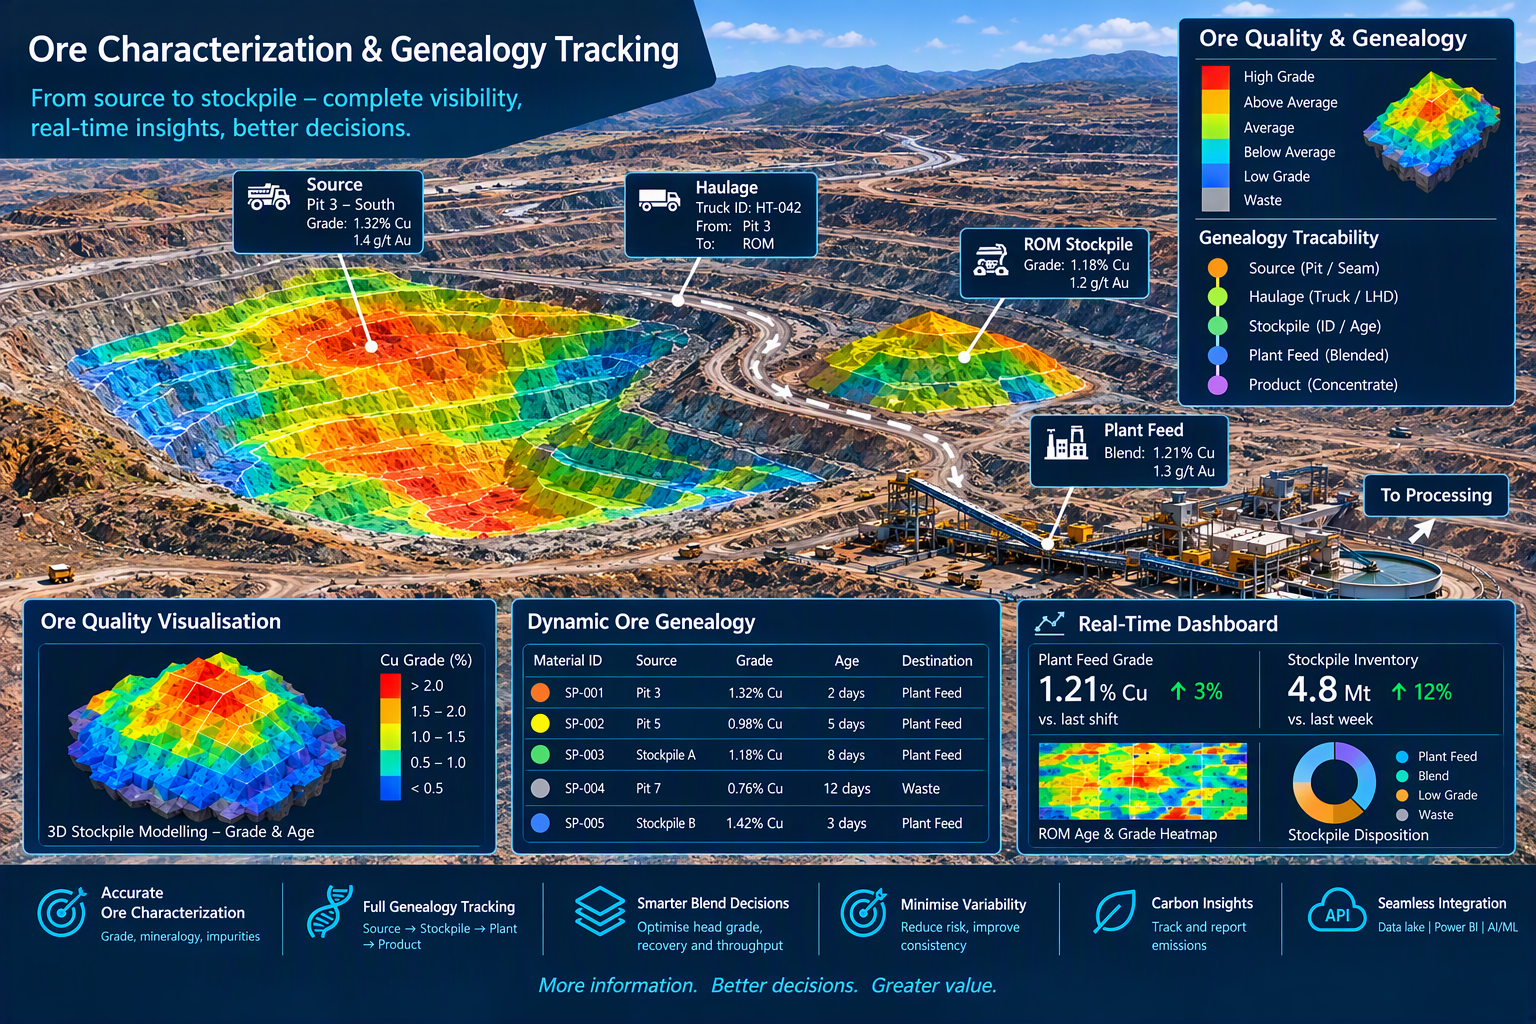


Live 3D model of every stockpile. Showing where each parcel of ore sits and what it is made of, with grade and quality attributes (headgrade, contaminants, hardness, moisture) tracked back to their source drawpoints, stopes or benches. Planners and plant operators can see the grade and composition of the stockpile in three dimensions, instead of relying on a single blended assay or a spreadsheet estimate. They can then forecast the feed and the headgrade the mill will actually receive.
Why it matters:
Know the feed before it arrives. Predict the headgrade and quality of upcoming plant feed from what is physically in the stockpile and in what sequence it will be reclaimed.
Make blending decisions with confidence. See high-grade, low-grade and problem material side by side, and decide what to reclaim and in what proportion to hit the target feed.
Cut variability into the plant. Smoother, more predictable feed supports steadier recovery, throughput and reagent use.
Trace every parcel back to its origin. Each tonne keeps its genealogy from drawpoint to stockpile to plant, so grade surprises can be explained and corrected at the source.
Reconcile with confidence. Compare the modelled stockpile against mill results to calibrate the model and close the loop between mine and plant.
One shared view. Geology, mine planning, operations and the plant all work from the same visual picture of the stockpile, which means fewer disputes about the numbers and faster decisions.
One-line version:
A live 3D view of stockpile quality that turns “what do we think is in there?” into “this is what the mill will see”, so you can control headgrade before it hits the feed belt.