A systematic structural geological mapping program is critical to determine the fold and fault structure of the mine. Such structural knowledge is necessary not only in determining the mineral resources but also in ensuring mine stability and safety (De Waele et al., 2018). The following is a proposed method of performing a thorough mapping program:
Direct face mapping and scanline surveys
The basis for any project is direct physical examination. The geologist makes detailed face mapping and scanline surveys in the exposed underground drifts. It is a very time-consuming process of detailed registration of strike and dip, spatial distribution of planar features, contacts of various lithologies, locations of fold hinges, and fault gouges. Recognition of the kinematic markers in these surveys will help trace successive deformational events and define the genetic linkages between structures and ore minerals (De Waele et al., 2018).
Multi-hole borehole imaging interpretation
Since physical access is limited to tunnels that have been excavated, structural data has to be interpreted through the process of diamond drilling exploration. Optical borehole televiewer (OTV) high-resolution imaging is utilized in the interpretation of defect spacings, natural fractures, and fractured zones within the rock body. Comparison of data obtained from deviated and vertical holes will enable geologists to create a quick 3D structural model that precisely identifies structural arrangements like fold plunges and fault dips (Dashti et al., 2019).
Incorporating 3D seismic and geophysical data
In order to define the structure of the rock mass especially between seams and interburdens, the high resolution 3D seismic survey is extremely important. Instead of focusing only on amplitude data, the geologists use structural attributes such as the instantaneous phase and frequency attributes. Structural attributes focus largely on event continuity. This enables the identification of angularities, discontinuities and fault pinches, which physical mapping cannot achieve (Paridon & Brandimarte, 2012).
Monitoring spatial changes in real time
Due to the dynamic changes occurring in the architecture of a mine due to its development process, monitoring is done in real time and is considered the last phase. Today’s mining uses the concept of geographic mapping in form of ultra sonic spherical array models to monitor the dynamic changes that occur as a result of mining (Zheng et al., 2013).
Through the integration of observations, well images, and attributes in the seismic wave, it is possible to define the underground architecture and maximize safety and mining efficiency.
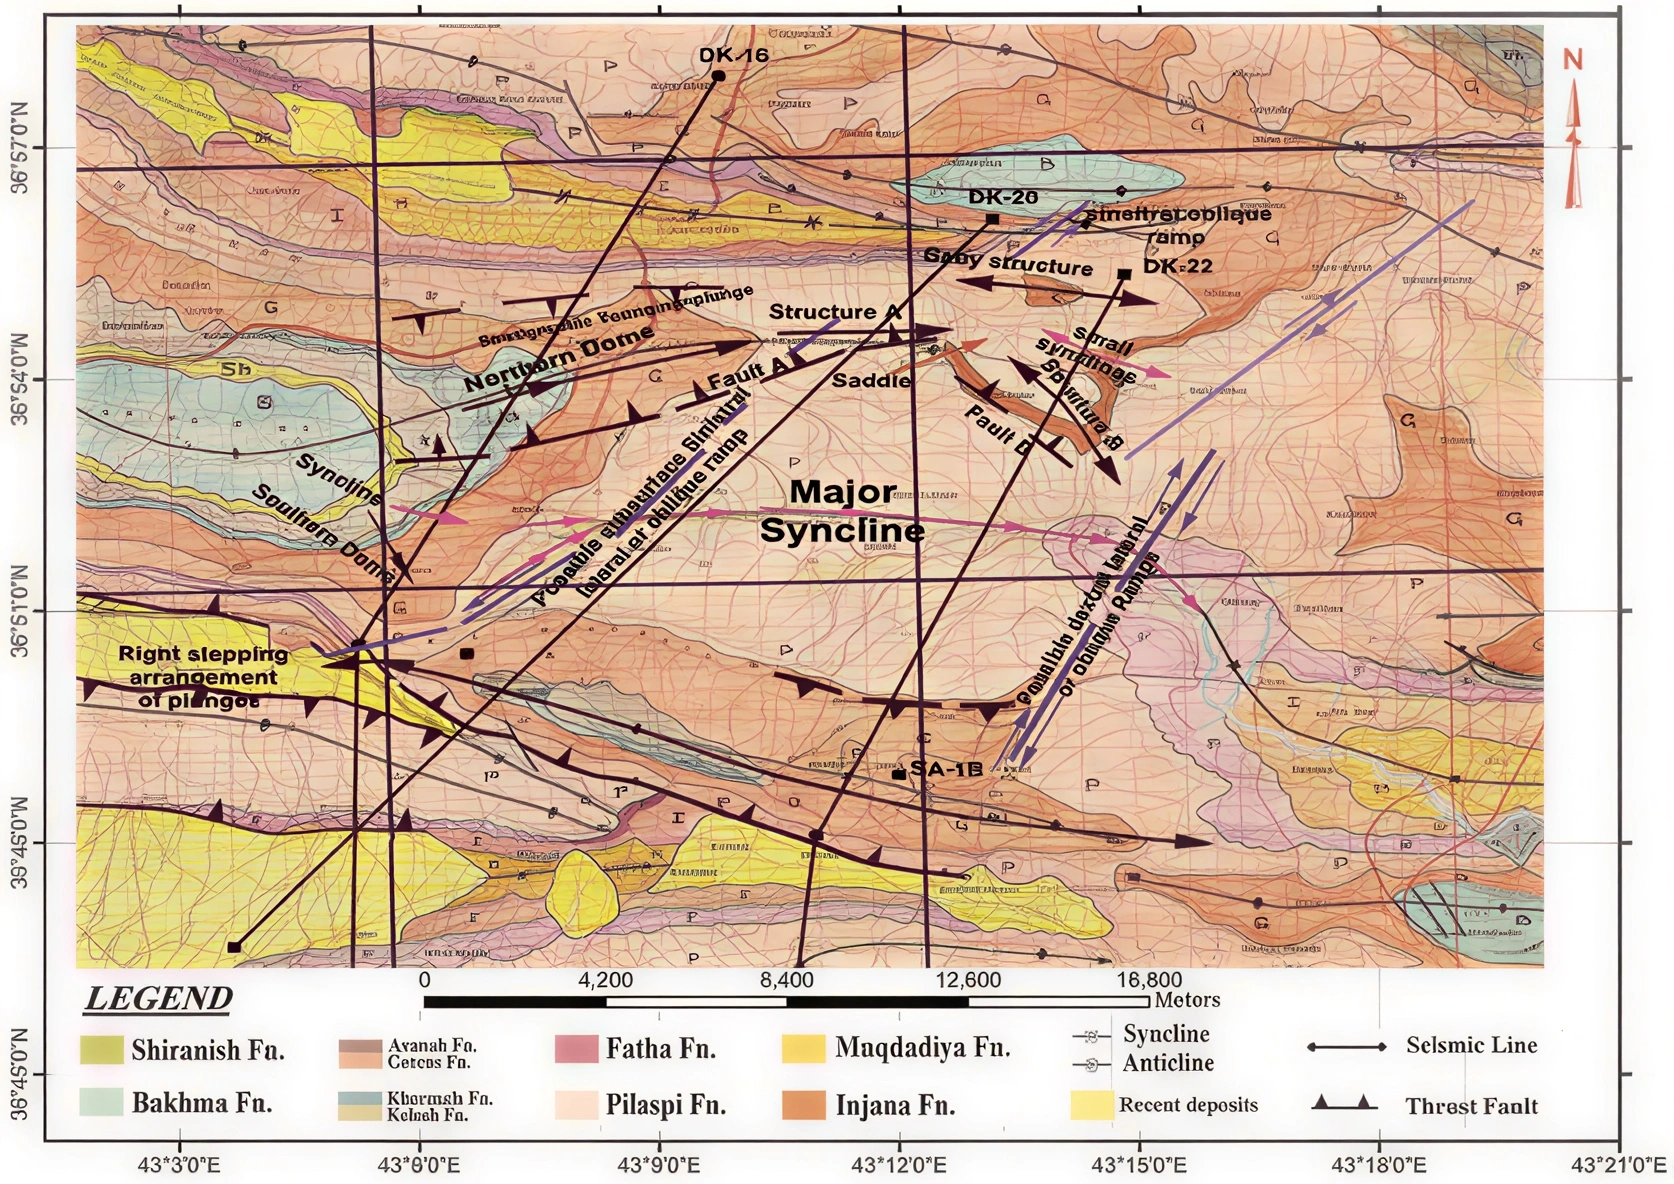
Image source: A structure geological map of the study area compiled from the field data, interpreted seismic sections (Sissakian, 1994)
References
Dashti, R., Birt, B., & Jangani, M. (2019). Quick structural modelling using multi-hole borehole image analysis; a critical input in mine planning. ASEG Extended Abstracts, 2019(1), 1–3. https://doi.org/10.1080/22020586.2019.12073016
De Waele, B., Lacorde, M., Cunningham, M., & Jupp, B. (2018). Understanding geology and structure: An essential part of mineral resource estimation. ASEG Extended Abstracts, 2018(1), 1–8. https://doi.org/10.1071/aseg2018abm2_2f
Paridon, H. v., & Brandimarte, F. (2012). Interburden mapping using 3D seismic attributes at an underground coal mine, Bowen Basin, Queensland. ASEG Extended Abstracts, 2012(1), 1–4. https://doi.org/10.1071/aseg2012ab416
Zheng, W., Li, Y., Lu, Q., & Lu, P. (2013). Geographic mapping model for underground structural deformation monitoring. Geomatics, Natural Hazards and Risk, 5(4), 353–372. https://doi.org/10.1080/19475705.2013.812994