
Sign In


Forgot Password?

Don't have account, Sign Up Here

Forgot Password

Lost your password? Please enter your email address. You will receive a link and will create a new password via email.


Have an account? Sign In Now

Sorry, you do not have permission to Add a Post, You must login to Add a Post.


Forgot Password?

Need An Account, Sign Up Here

Sorry, you do not have permission to add Article.


Forgot Password?

Need An Account, Sign Up Here

Please briefly explain why you feel this Post should be reported.

Please briefly explain why you feel this Comment should be reported.

Please briefly explain why you feel this user should be reported.

Mining Doc Logo Mining Doc Logo Mining Doc Logo
Sign InSign Up

Mining Doc

Mining Doc Navigation

  • Home
    • About
    • Contact us
  • Mining articles
  • Online Courses
Search
Sign up

Mobile menu

Close
join for free
  • Home
  • Online courses
  • Case study
  • Mining Community
  • Solutions listing
    • Lase Solutions
    • O-PitBlast Solutions
    • Continuous Mining
    • Longwall mining
    • Geosight Scanners
    • LoopX AI
    • Terafil solutions
    • Blasting solutions
    • Geotechnical
    • Submersible Pumps
    • Mine rescue system
    • Ore sorting
    • Whittle Consulting Solutions
  • Add Blog
  • Feed
  • User Profile
  • Posts
    • New Posts
    • Trending Posts
    • Must read Posts
    • Hot Posts
  • Polls
  • Badges
  • Home
    • About
    • Contact us
  • Mining articles
  • Online Courses

Mining Doc Latest Posts

Mining Doc
  • 0
  • 0
Mining DocExplainer
Added: September 29, 20262026-09-29T07:18:23-04:00 2026-09-29T07:18:23-04:00In: Geology

How to interpret duplicate sample pairs to distinguish sampling error from analytical error?

  • 0
  • 0

Quality control in the environmental, geological, and geochemical surveys is dependent upon the accuracy of chemical analyses. Analysts collect duplicate sample pairs to estimate the combined uncertainty in the measurements. The differences observed between the duplicate measurements may cause misunderstandings if the manager cannot distinguish between sampling error in the field and analysis error in the laboratory. Sampling error is due to the heterogeneity and sampling process of the site while analysis error is caused by the laboratory preparation and equipment. Duplicate samples are used as the means to identify both errors.

Discrimination between measurement error requires an experimental design with two levels of replication. The field duplicates are independent primary samples taken at the same location using identical methodology and encompassing variation due to spatial heterogeneity, field sampling techniques, and analysis process. The laboratory duplicates are replicates taken from the same field sample but analysed in duplicate under conditions of repeatability to measure analytical variation only.

A QC program employing the use of duplicates involves the use of this design at selected sites that constitute ten percent of all sampling sites or at least eight sites. In a balanced design, both primary field samples are analysed in duplicate in the lab, resulting in four values for each target site.

The unbalanced nested design involves the duplicate analysis of only one of the primary field samples. This unbalanced design saves approximately one-third of laboratory cost, while still retaining proper degrees of freedom. The randomization of all sub-samples ensures unbiased precision estimates.

Variance analysis in general and analysis of variance (ANOVA) in particular serve as the main statistical approach used for splitting the overall data variance into the following additive parts: between-target variance, sampling variance, and analytical variance. Overall uncertainty associated with measurements equals the square root of the sum of sampling and analytical variances. In cases where the distribution is heavily skewed or contains outliers, RANOVA proves useful in that it reduces the weight of such outliers thus preventing the overestimation of population uncertainty. If relative standard deviations reach more than twenty percent or concentrations cover different orders of magnitude, the log-transformation helps in variance stabilization.

There are graphical techniques in addition to ANOVA calculations. The Thompson-Howarth plot serves as a tool for assessing precision within dynamic ranges via plotting absolute differences between two duplicates against average concentration. Calculations of relative percent differences (RPDs) and R-charts serve as a way of establishing upper warning and action limits based on standard deviations.

Empirical studies have proven repeatedly that field sampling variance accounts for most of the measurement uncertainty of natural materials; at times, over seventy to ninety percent of total variance is due to field sampling variance, while analytical errors account for less than ten percent of total uncertainty. A large relative percent difference in field duplicates along with a small relative percent difference in laboratory duplicates indicates sample heterogeneity, a low sample mass, or lack of field sample homogenization, while a large relative percent difference in laboratory duplicates implies instrumentation problems or calibration issues.

A corrective action must focus on addressing the dominant source of error to improve data cost-effectively. Redundant analysis adds to costs but does not help minimize total measurement error since field sampling is the dominant source of uncertainty. Managers can improve the accuracy of data by increasing the size of the primary sample, collecting multi-increment composite samples, or improving field splitting procedures.

The concept of duplicate samples is of immense importance in providing a means for diagnosing whether errors are associated with the sampling process at the field level or in the analytical lab process. Well-designed nested experiment designs help achieve the partitioning of variances through analysis of variance. The measurement uncertainty must be fit for purpose such that it accounts for less than twenty percent of the overall variance in the dataset. Quality control in the field helps avoid wasting resources in re-analysis of uncertainties arising from spatial variability.
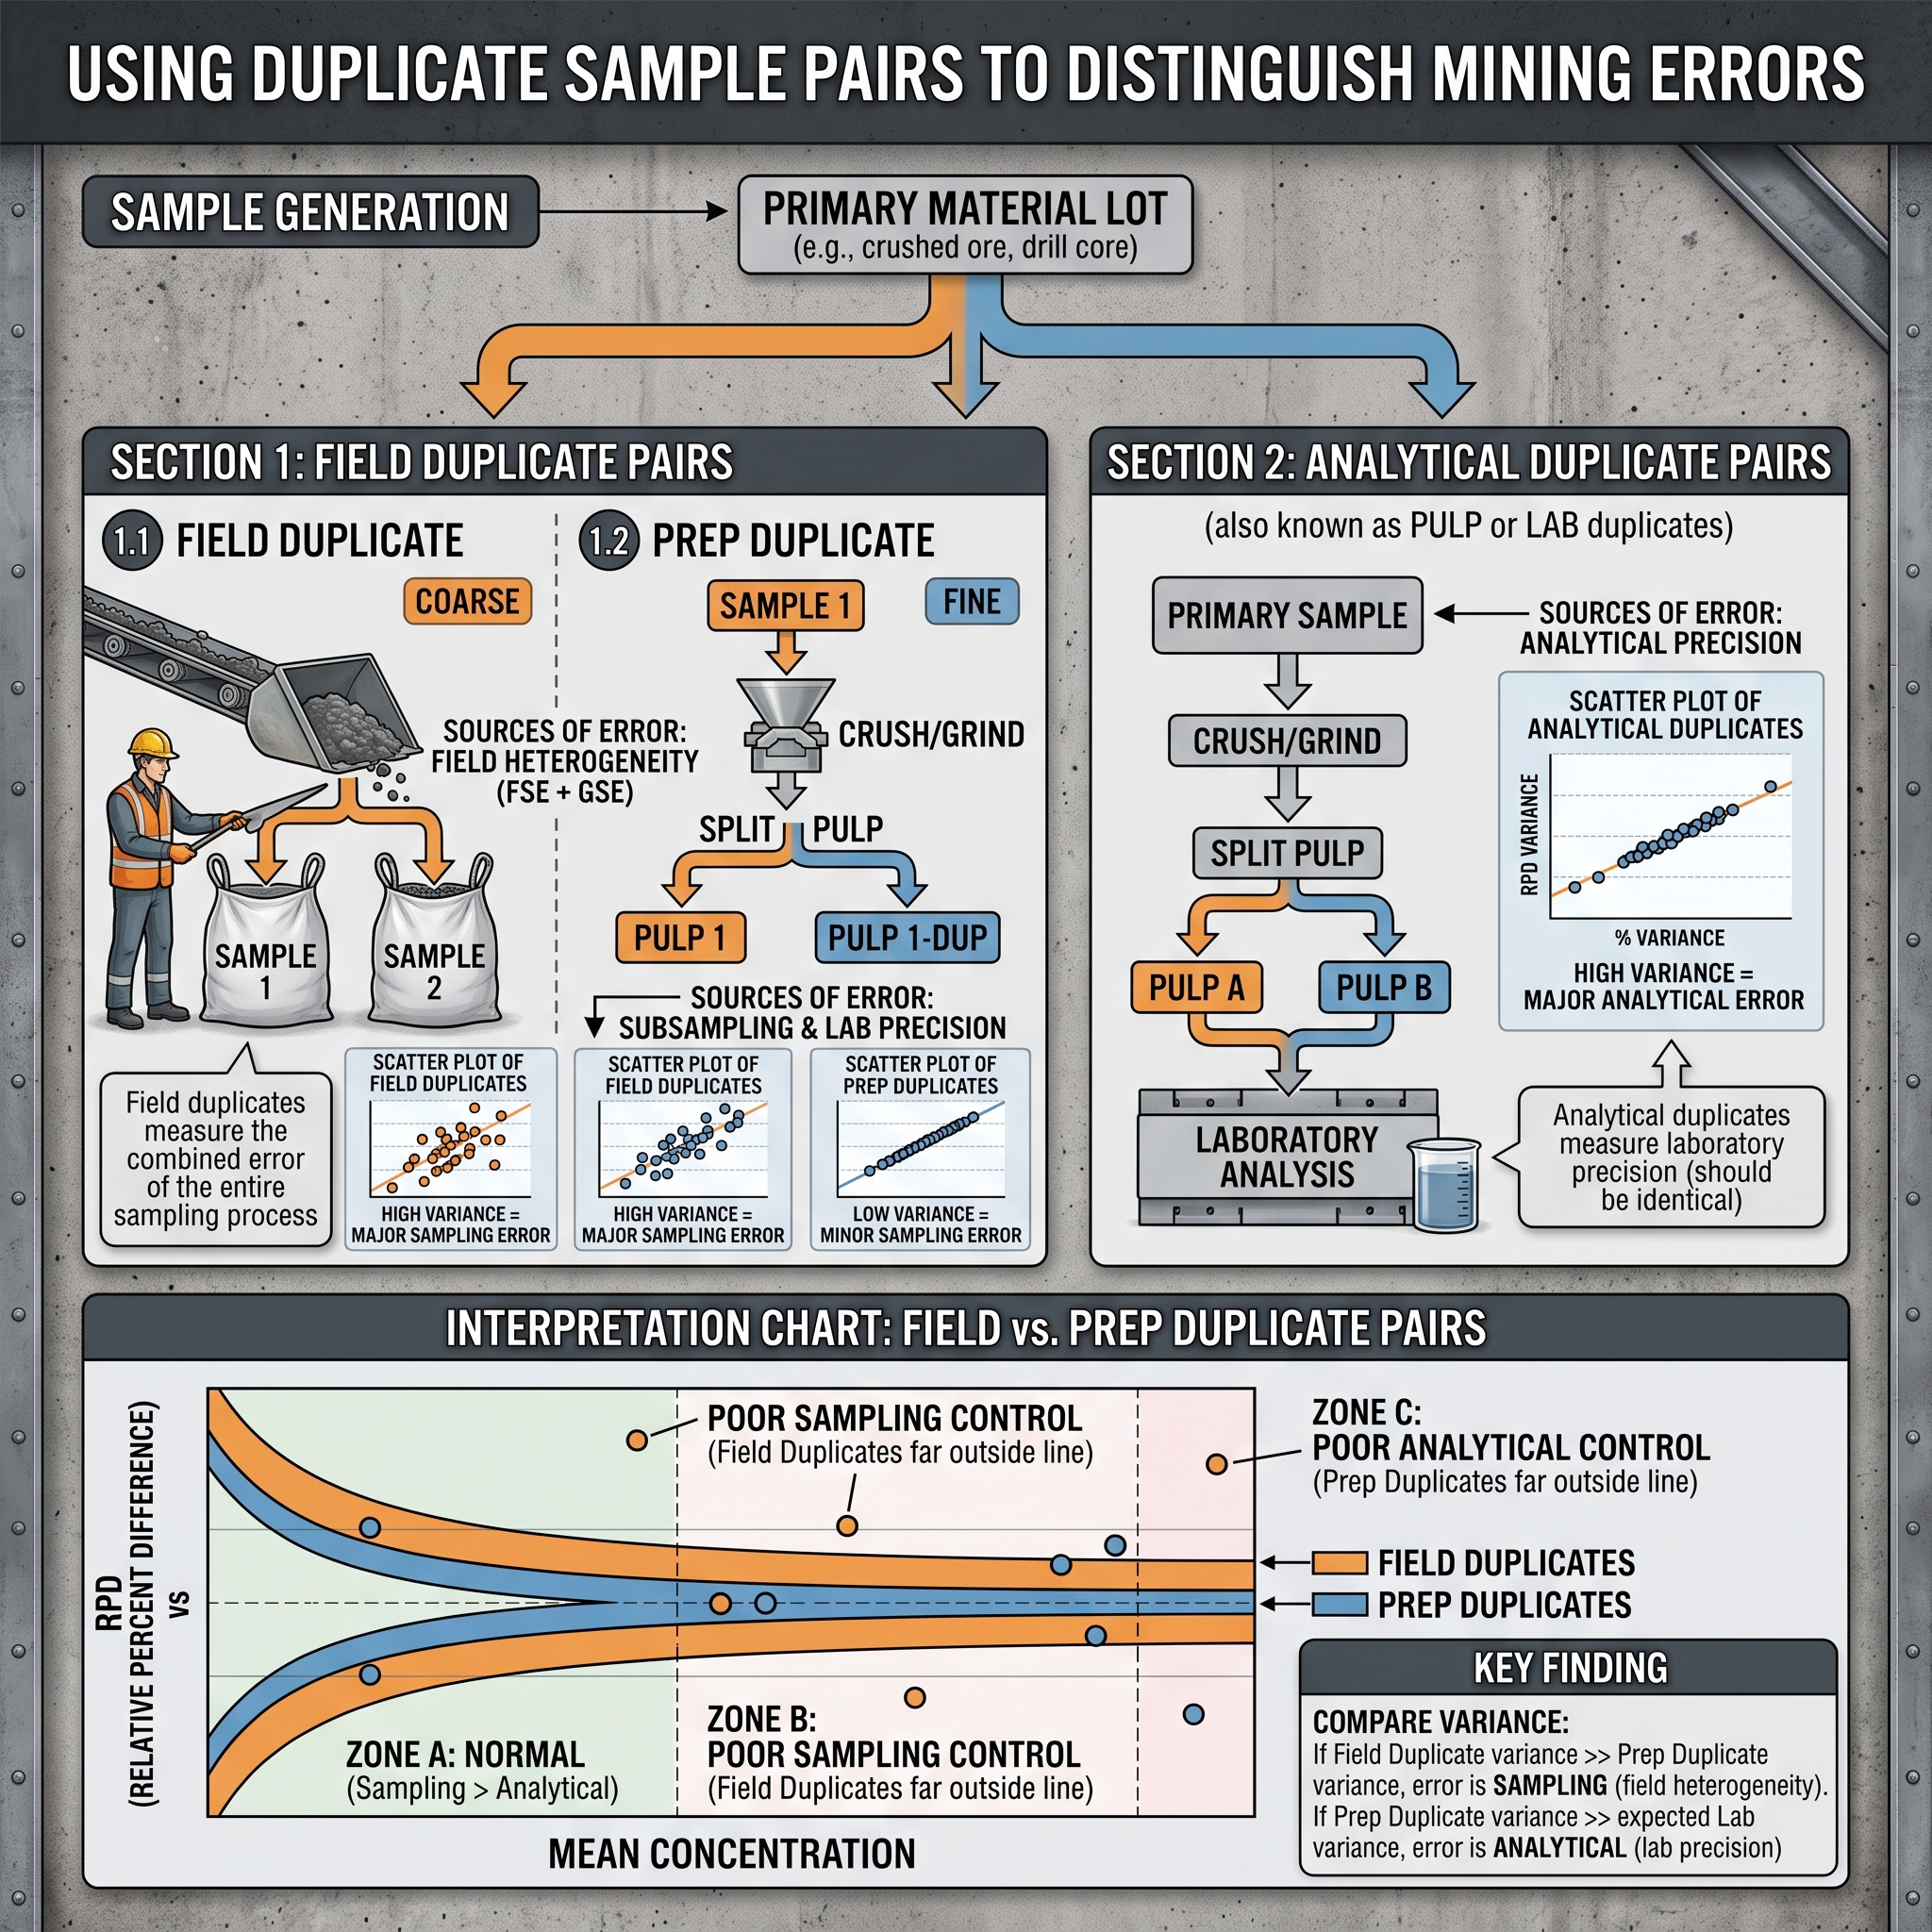

How to interpret duplicate sample pairs to distinguish sampling error from analytical error?
0
  • 0 0 Comments
  • 25 Views
  • 25 Reactions
  • 0 Followers
  • 0
    • Report
  • Share
    Share
    • Share on Facebook
    • Share on Twitter
    • Share on LinkedIn
    • Share on WhatsApp

Related Posts

  • What's the correct QA/QC protocol for detecting assay lab bias using certified reference materials and blanks?
  • What are the key indicators separating orogenic gold systems from intrusion-related gold systems in the field?
  • How to build a reliable 3D structural model when outcrop is limited to less than 10% exposure?

You must login to add an Comment.


Forgot Password?

Need An Account, Sign Up Here
aalan

Sidebar

Sponsored Ads

aalan
  • Recent
  • How Mining and Construction Sites Can Reduce Theft and Unauthorized Access
    • On: September 29, 2026

    How Mining and Construction Sites Can Reduce Theft and Unauthorized ...

  • The real state of hydrogen fuel cell adoption for heavy mining haulage compared to battery-electric
    • On: September 29, 2026

    The real state of hydrogen fuel cell adoption for heavy ...

  • Why High-Frequency Telemetry Matters in Mining
    • On: September 28, 2026

    Why High-Frequency Telemetry Matters in Mining

  • Tracked Cone Crusher for Granite Crushing: Process Configuration, Wear Management, and Product Control
    • On: September 28, 2026

    Tracked Cone Crusher for Granite Crushing: Process Configuration, Wear Management, ...

  • How Better Frontline Communication Can Improve Mining Operations
    • On: September 28, 2026

    How Better Frontline Communication Can Improve Mining Operations

    • On: September 28, 2026

    From Mining to Medicine: How Minerals Support the Pharmaceutical Industry

  • How to Calculate Aggregate Production from a Stone Crushing Plant?
    • On: September 24, 2026

    How to Calculate Aggregate Production from a Stone Crushing Plant?

Go to Home page to view more

Top Members

Olena Skyba

Olena Skyba

  • 150 Posts
  • 2 Comments
Pundit
Marcial

Marcial

  • 91 Posts
  • 0 Comments
Enlightened
Jean Marais (Sanodea Group)

Jean Marais (Sanodea Group)

  • 26 Posts
  • 0 Comments
Beginner
Trending on Mining Doc

Trending Communities

Fixed Plant General Information Geology Mining Case Studies Mining Doc Documentary Mining Engineering Mining Events Mining Finance and Economy Mining Human Resources Mining Industry Research Mining Operations Mining Software Solutions Mining Sustainability Mining Technology Solutions Mobile Plant Equipment

Explore

  • Home
  • Online courses
  • Case study
  • Mining Community
  • Solutions listing
    • Lase Solutions
    • O-PitBlast Solutions
    • Continuous Mining
    • Longwall mining
    • Geosight Scanners
    • LoopX AI
    • Terafil solutions
    • Blasting solutions
    • Geotechnical
    • Submersible Pumps
    • Mine rescue system
    • Ore sorting
    • Whittle Consulting Solutions
  • Add Blog
  • Feed
  • User Profile
  • Posts
    • New Posts
    • Trending Posts
    • Must read Posts
    • Hot Posts
  • Polls
  • Badges

Footer

Mining Doc

Join our community and connect with other people in the Mining industry for knowledge sharing.

Legal Stuff

  • Privacy Policy
  • Terms of Service

Help

  • Support
  • FAQs
  • How to add new content and how to promote a content
  • Compliance and guidelines
  • Subscribe to Mining Doc

Follow

© 2026 Mining Doc. All Rights Reserved